


Note
Click here to download the full example code
PyTorch Profiler With TensorBoard
This tutorial demonstrates how to use TensorBoard plugin with PyTorch Profiler to detect performance bottlenecks of the model.
Introduction
PyTorch 1.8 includes an updated profiler API capable of recording the CPU side operations as well as the CUDA kernel launches on the GPU side. The profiler can visualize this information in TensorBoard Plugin and provide analysis of the performance bottlenecks.
In this tutorial, we will use a simple Resnet model to demonstrate how to use TensorBoard plugin to analyze model performance.
Steps
- Prepare the data and model
- Use profiler to record execution events
- Run the profiler
- Use TensorBoard to view results and analyze performance
- Improve performance with the help of profiler
1. Prepare the data and model
First, import all necessary libraries:
import torch
import torch.nn
import torch.optim
import torch.profiler
import torch.utils.data
import torchvision.datasets
import torchvision.models
import torchvision.transforms as T
Then prepare the input data. For this tutorial, we use the CIFAR10 dataset. Transform it to the desired format and use DataLoader to load each batch.
transform = T.Compose(
    [T.Resize(224),
     T.ToTensor(),
     T.Normalize((0.5, 0.5, 0.5), (0.5, 0.5, 0.5))])
train_set = torchvision.datasets.CIFAR10(root='./data', train=True, download=True, transform=transform)
train_loader = torch.utils.data.DataLoader(train_set, batch_size=32, shuffle=True)
Next, create Resnet model, loss function, and optimizer objects. To run on GPU, move model and loss to GPU device.
device = torch.device("cuda:0")
model = torchvision.models.resnet18(pretrained=True).cuda(device)
criterion = torch.nn.CrossEntropyLoss().cuda(device)
optimizer = torch.optim.SGD(model.parameters(), lr=0.001, momentum=0.9)
model.train()
Define the training step for each batch of input data.
def train(data):
    inputs, labels = data[0].to(device=device), data[1].to(device=device)
    outputs = model(inputs)
    loss = criterion(outputs, labels)
    optimizer.zero_grad()
    loss.backward()
    optimizer.step()
2. Use profiler to record execution events
The profiler is enabled through the context manager and accepts several parameters, some of the most useful are:
schedule- callable that takes step (int) as a single parameter and returns the profiler action to perform at each step; In this example withwait=1, warmup=1, active=5, profiler will skip the first step/iteration, start warming up on the second, record the following five iterations, after which the trace will become available and on_trace_ready (when set) is called; The cycle repeats starting with the next step until the loop exits. Duringwaitsteps, the profiler does not work. Duringwarmupsteps, the profiler starts profiling as warmup but does not record any events. This is for reducing the profiling overhead. The overhead at the beginning of profiling is high and easy to bring skew to the profiling result. Duringactivesteps, the profiler works and records events.on_trace_ready- callable that is called at the end of each cycle; In this example we usetorch.profiler.tensorboard_trace_handlerto generate result files for TensorBoard. After profiling, result files will be saved into the./log/resnet18directory. Specify this directory as alogdirparameter to analyze profile in TensorBoard.record_shapes- whether to record shapes of the operator inputs.
with torch.profiler.profile(
        schedule=torch.profiler.schedule(wait=1, warmup=1, active=5),
        on_trace_ready=torch.profiler.tensorboard_trace_handler('./log/resnet18'),
        record_shapes=True
) as prof:
    for step, batch_data in enumerate(train_loader):
        if step >= 7:
            break
        train(batch_data)
        prof.step()  # Need call this at the end of each step to notify profiler of steps' boundary.
3. Run the profiler
Run the above code. The profiling result will be saved under ./log directory.
4. Use TensorBoard to view results and analyze performance
Install PyTorch Profiler TensorBoard Plugin.
pip install torch_tb_profiler
Launch the TensorBoard.
tensorboard --logdir=./log
Open the TensorBoard profile URL in Google Chrome browser or Microsoft Edge browser.
http://localhost:6006/#pytorch_profiler
You could see Profiler plugin page as shown below.
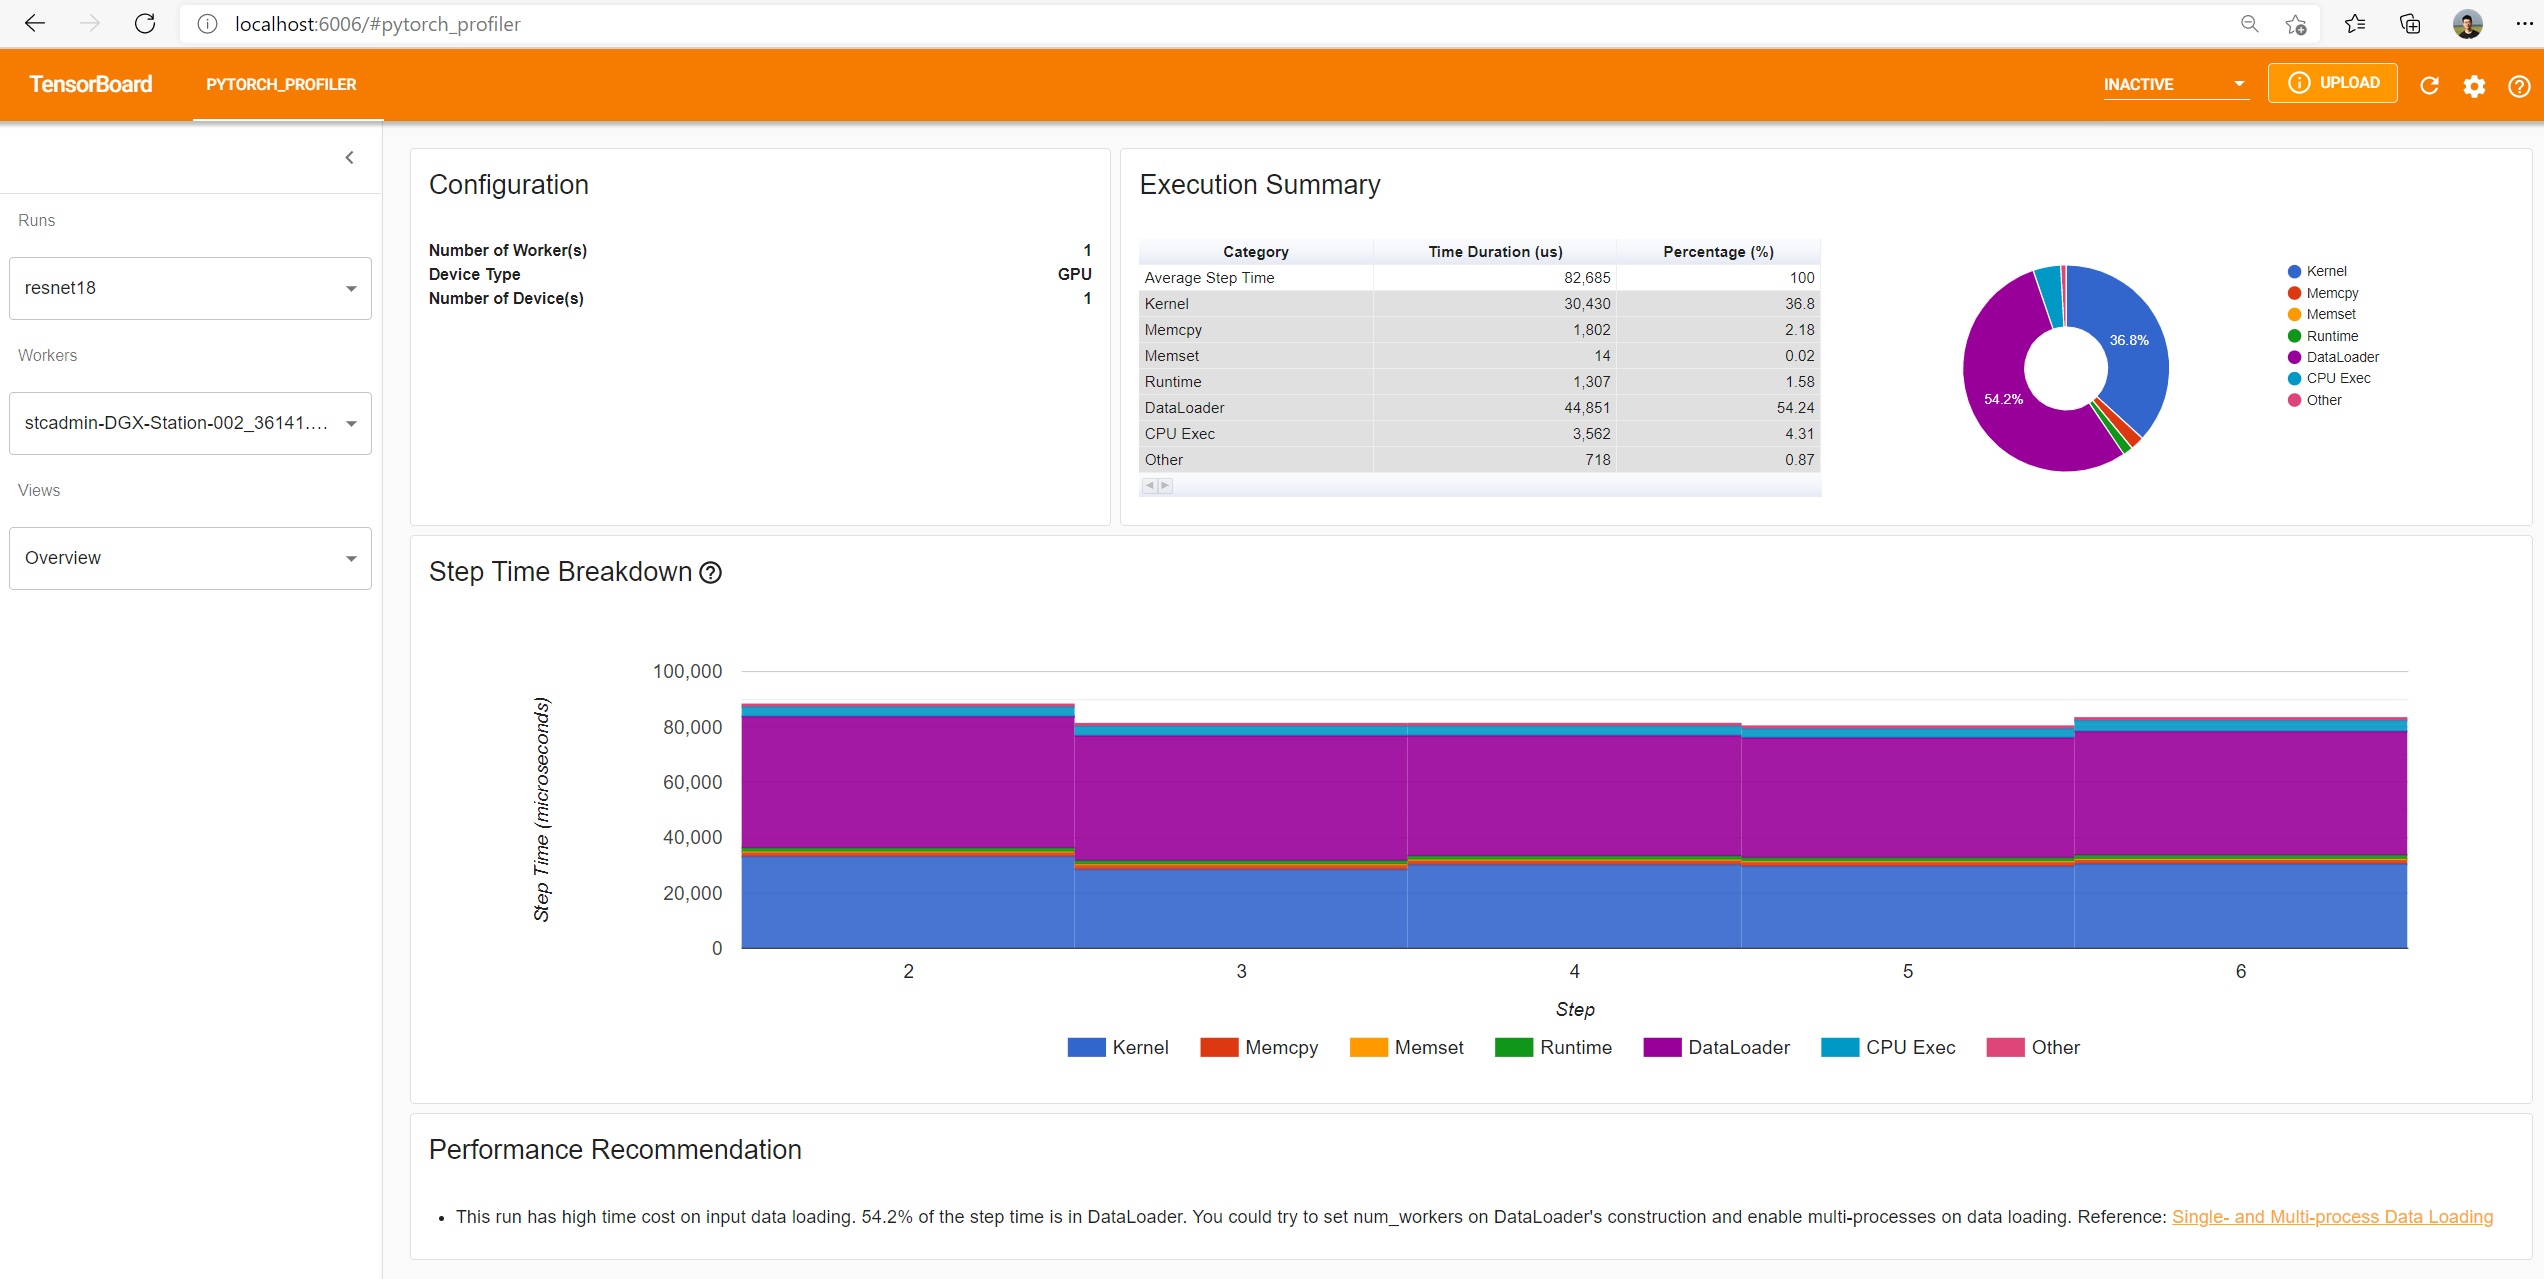
The overview shows a high-level summary of model performance.
The “Step Time Breakdown” shows distribution of time spent in each step over different categories of execution.
In this example, you can see the DataLoader overhead is significant.
The bottom “Performance Recommendation” uses the profiling data to automatically highlight likely bottlenecks, and gives you actionable optimization suggestions.
You can change the view page in left “Views” dropdown list.
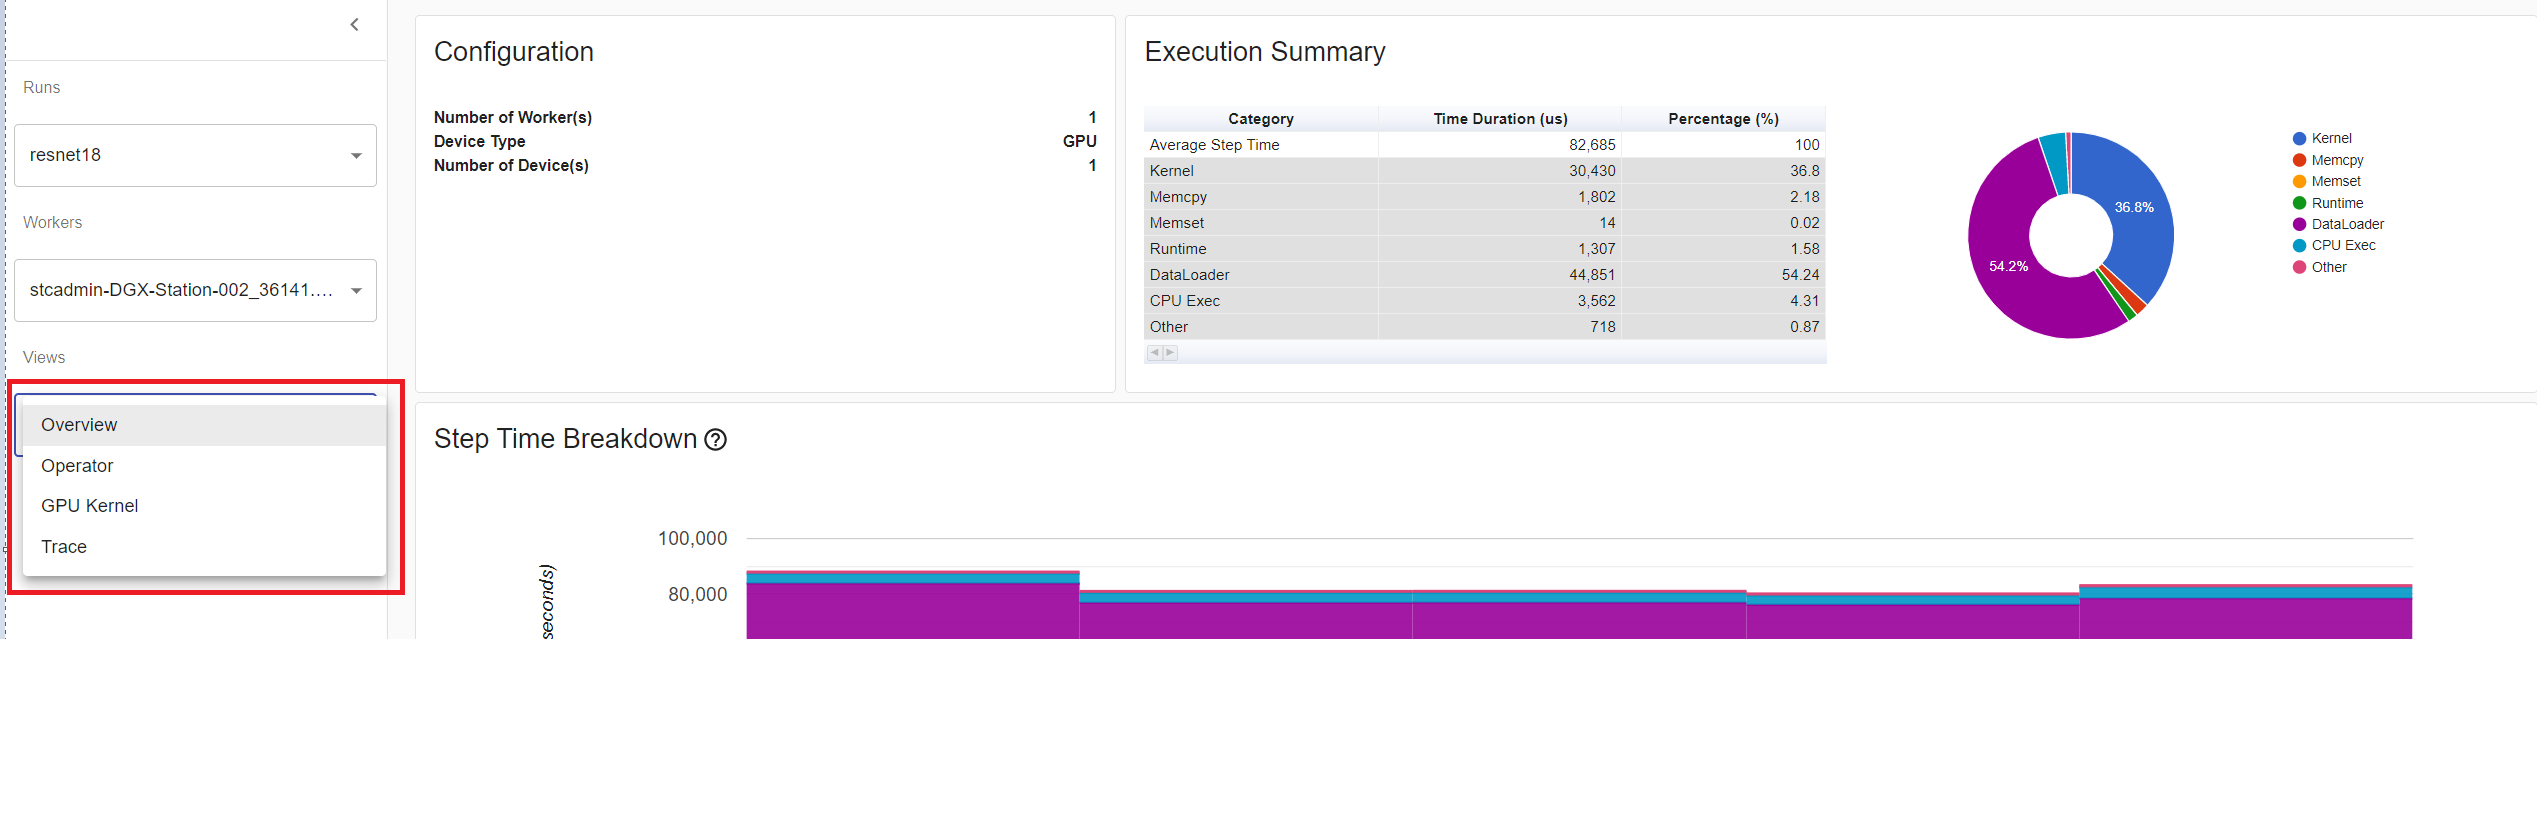
The operator view displays the performance of every PyTorch operator that is executed either on the host or device.
The GPU kernel view shows all kernels’ time spent on GPU.
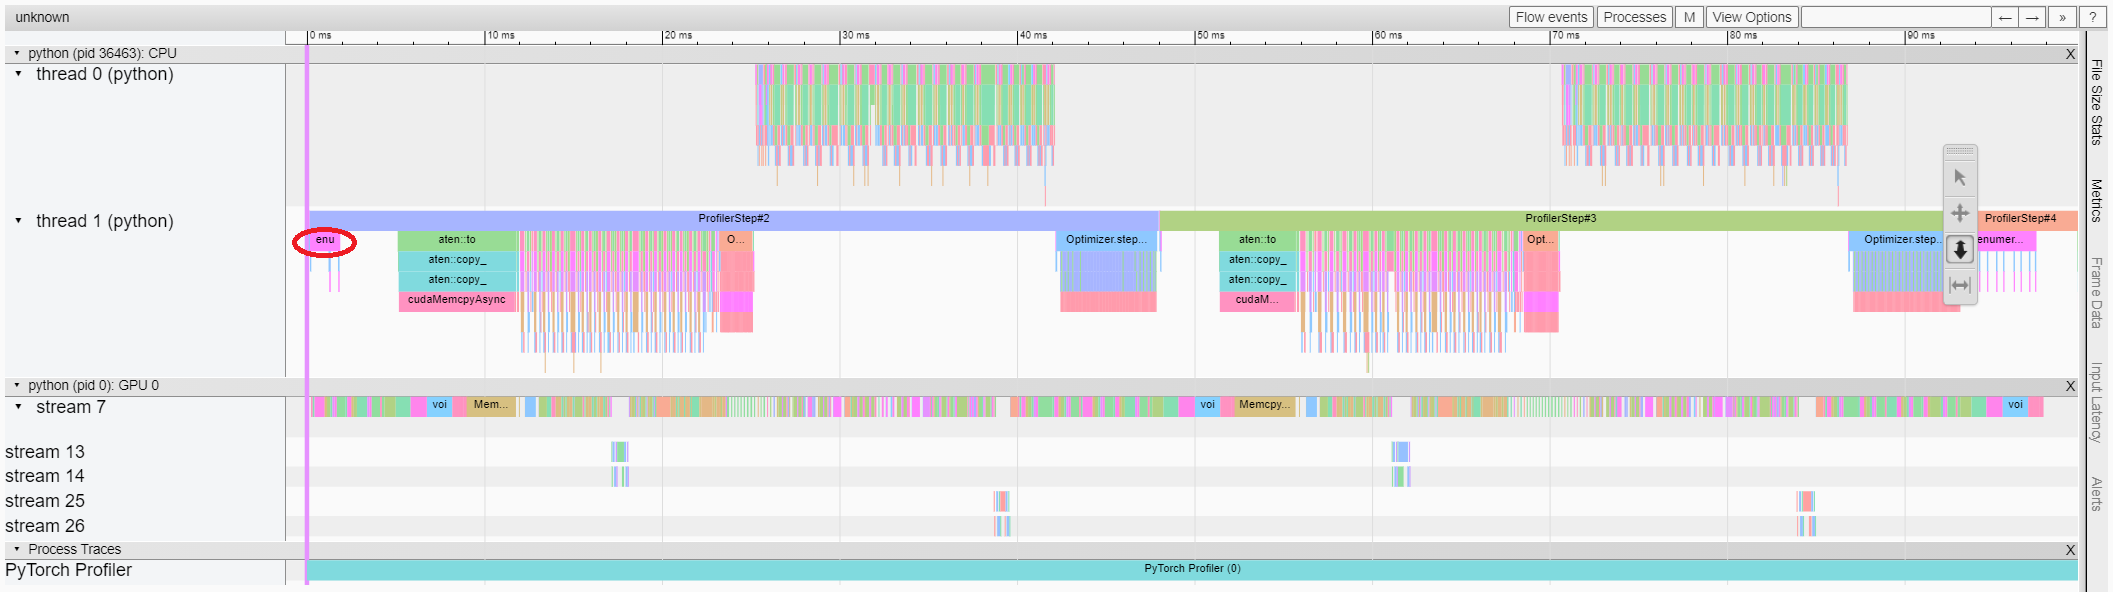
The trace view shows timeline of profiled operators and GPU kernels. You can select it to see details as below.
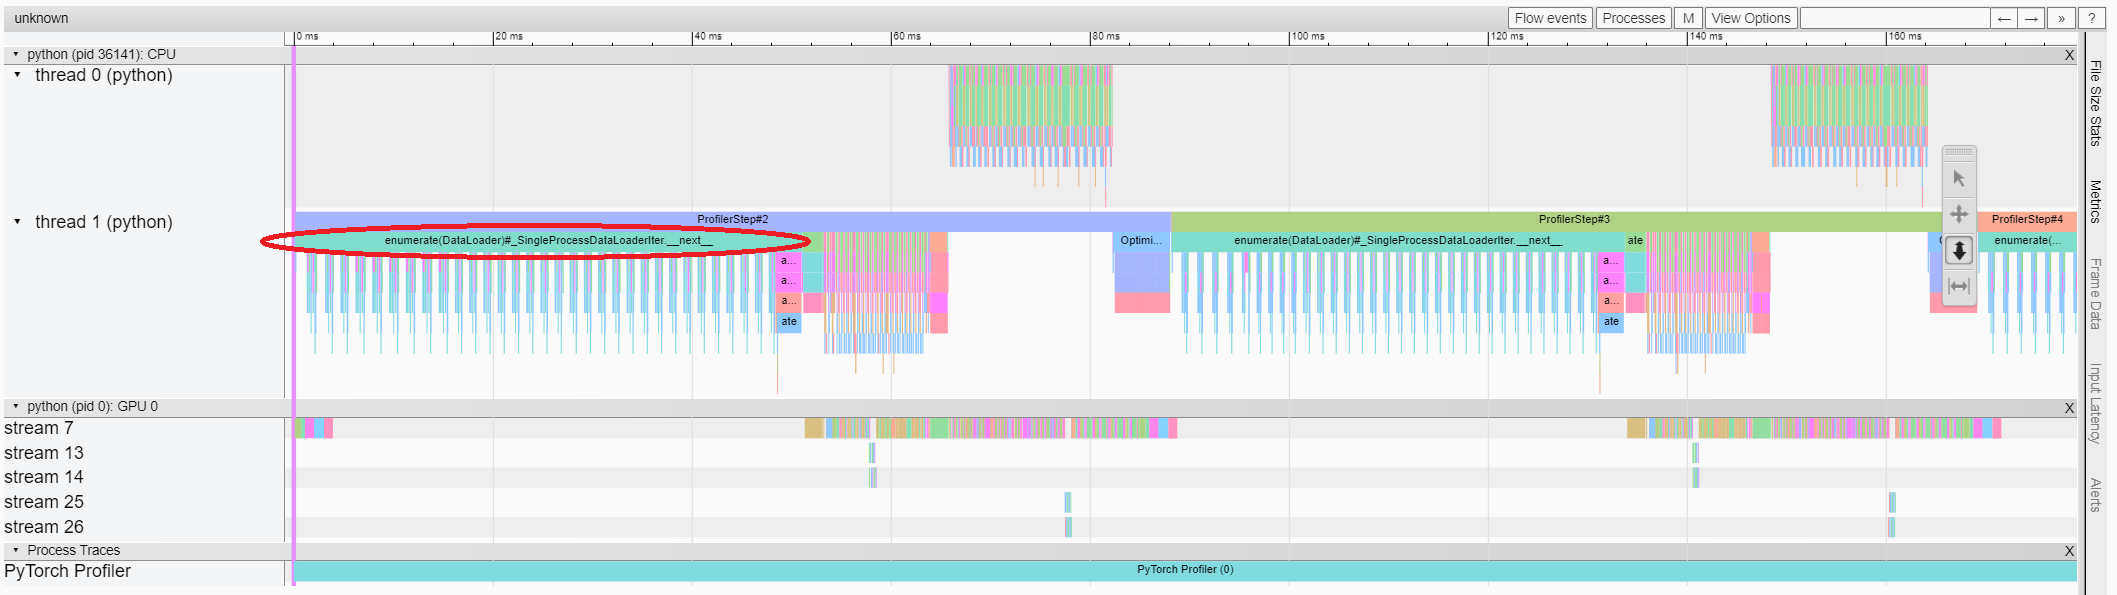
You can move the graph and zoom in/out with the help of right side toolbar.
In this example, we can see the event prefixed with enumerate(DataLoader) costs a lot of time.
And during most of this period, the GPU is idle.
Because this function is loading data and transforming data on host side,
during which the GPU resource is wasted.
5. Improve performance with the help of profiler
The PyTorch DataLoader uses single process by default.
User could enable multi-process data loading by setting the parameter num_workers.
Here is more details.
In this example, we can set num_workers as below,
pass a different name such as ./log/resnet18_4workers to tensorboard_trace_handler, and run it again.
train_loader = torch.utils.data.DataLoader(train_set, batch_size=32, shuffle=True, num_workers=4)
Then let’s choose the just profiled run in left “Runs” dropdown list.
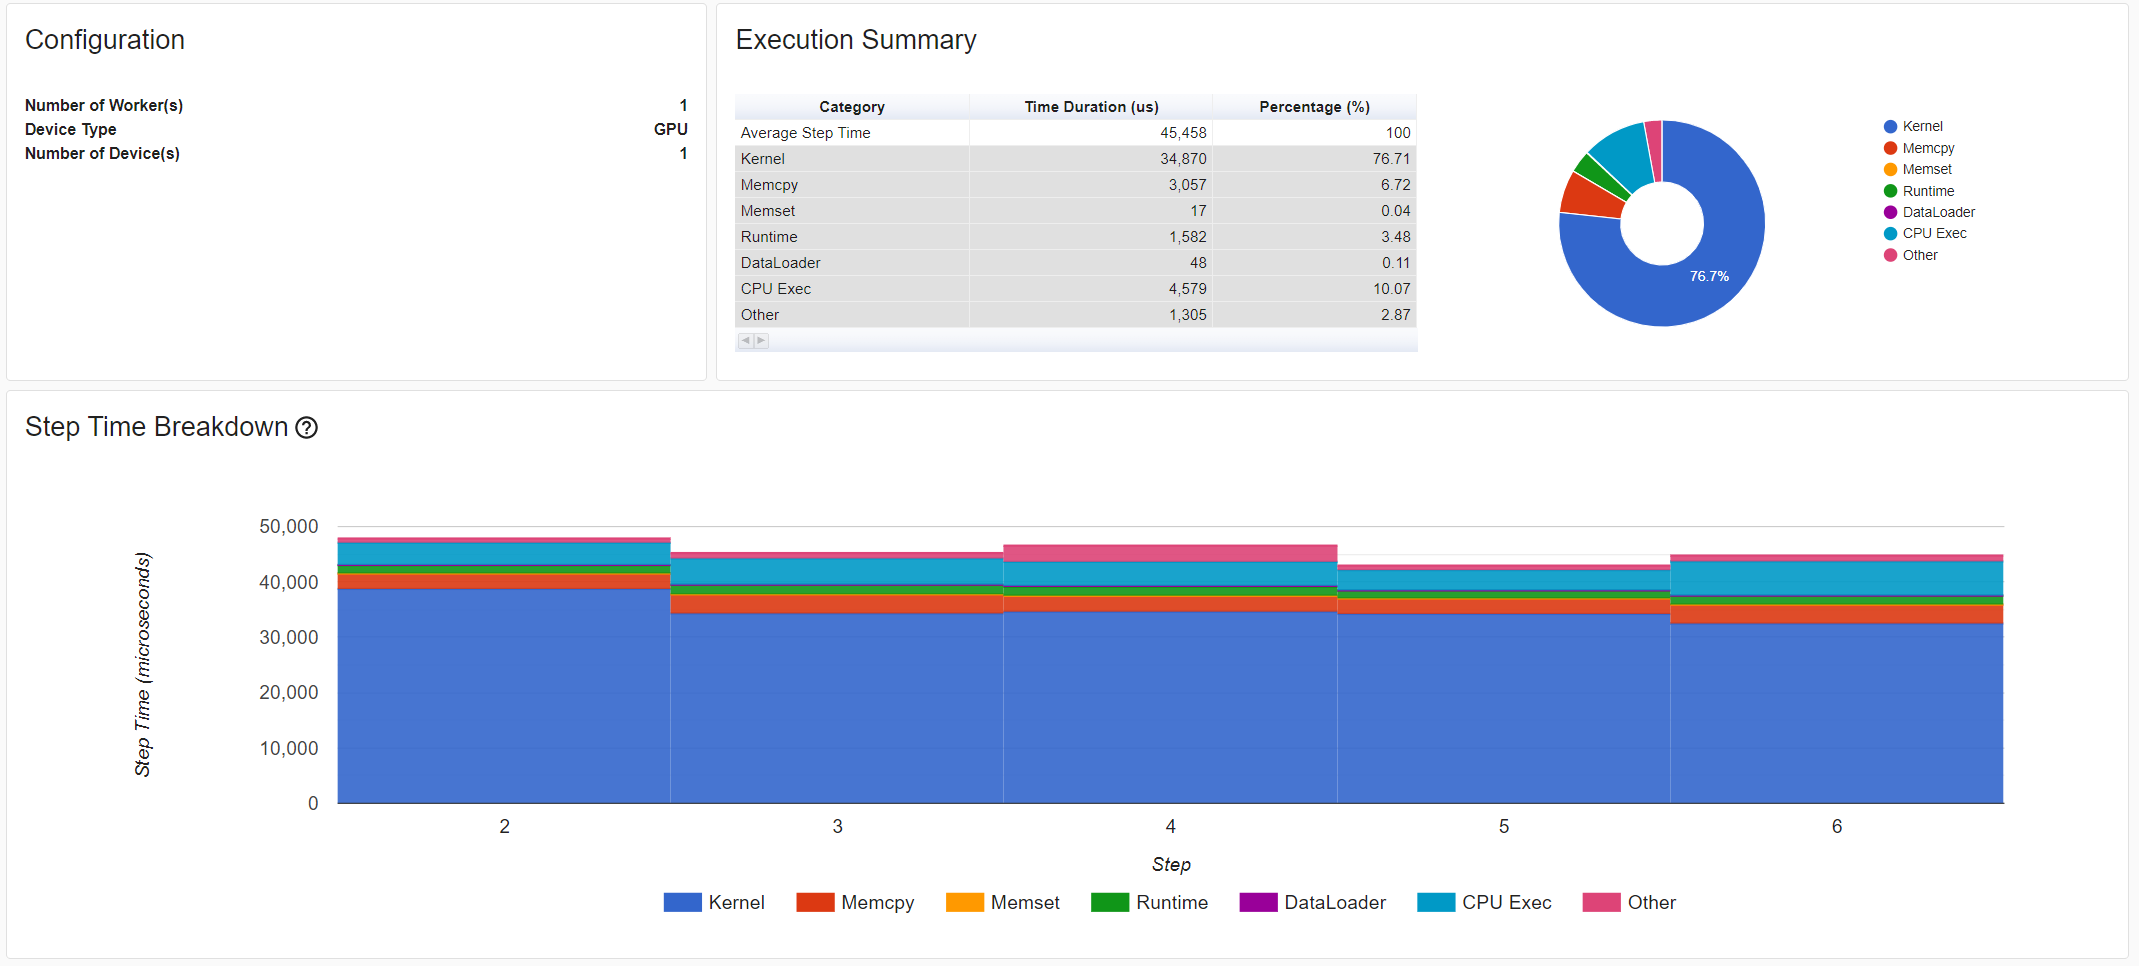
From the above view, we can find the step time is reduced,
and the time reduction of DataLoader mainly contributes.
From the above view, we can see that the runtime of enumerate(DataLoader) is reduced,
and the GPU utilization is increased.
Learn More
Take a look at the following documents to continue your learning:
Total running time of the script: ( 0 minutes 0.000 seconds)
